 GSDAQ
GSDAQ


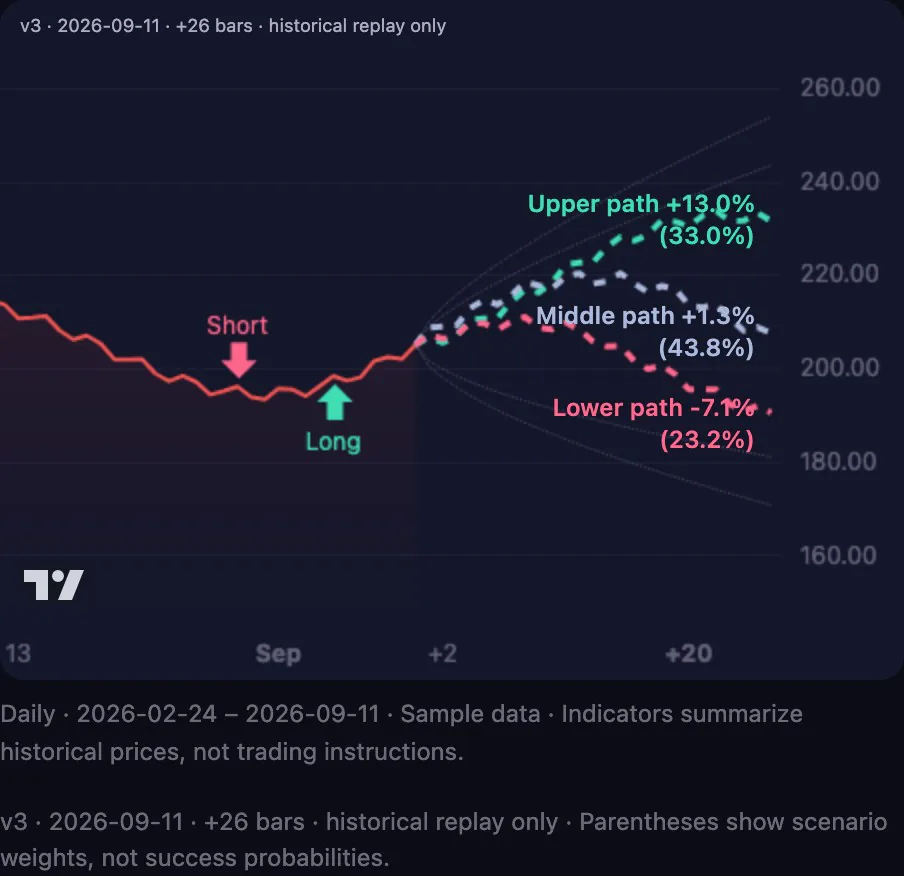
Three possible paths
Compare upper, middle and lower scenarios from similar past patterns. Weights are historical shares, not profit probabilities.
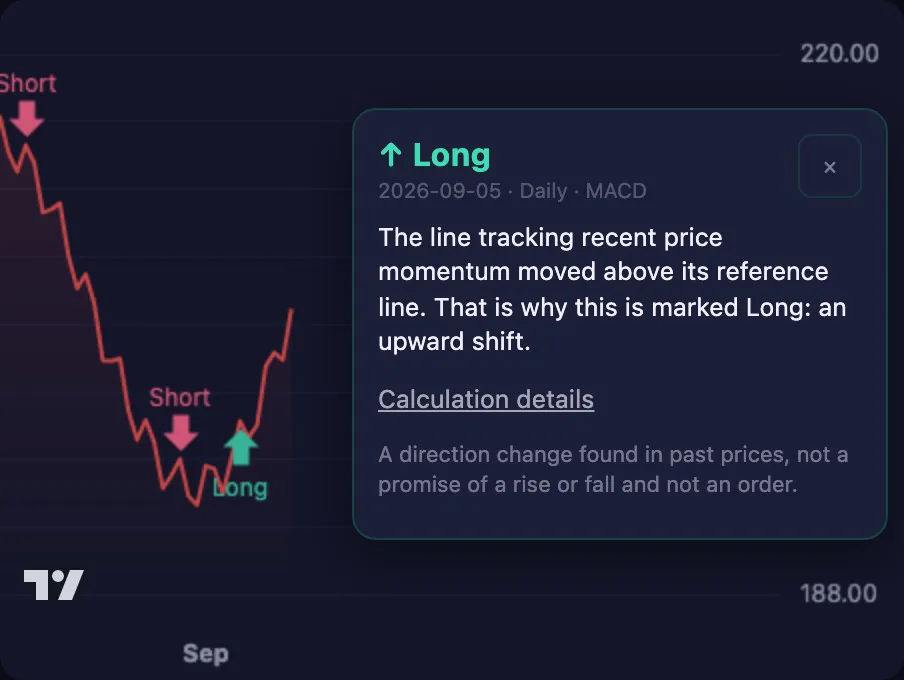
Tap a signal. Read the reason.
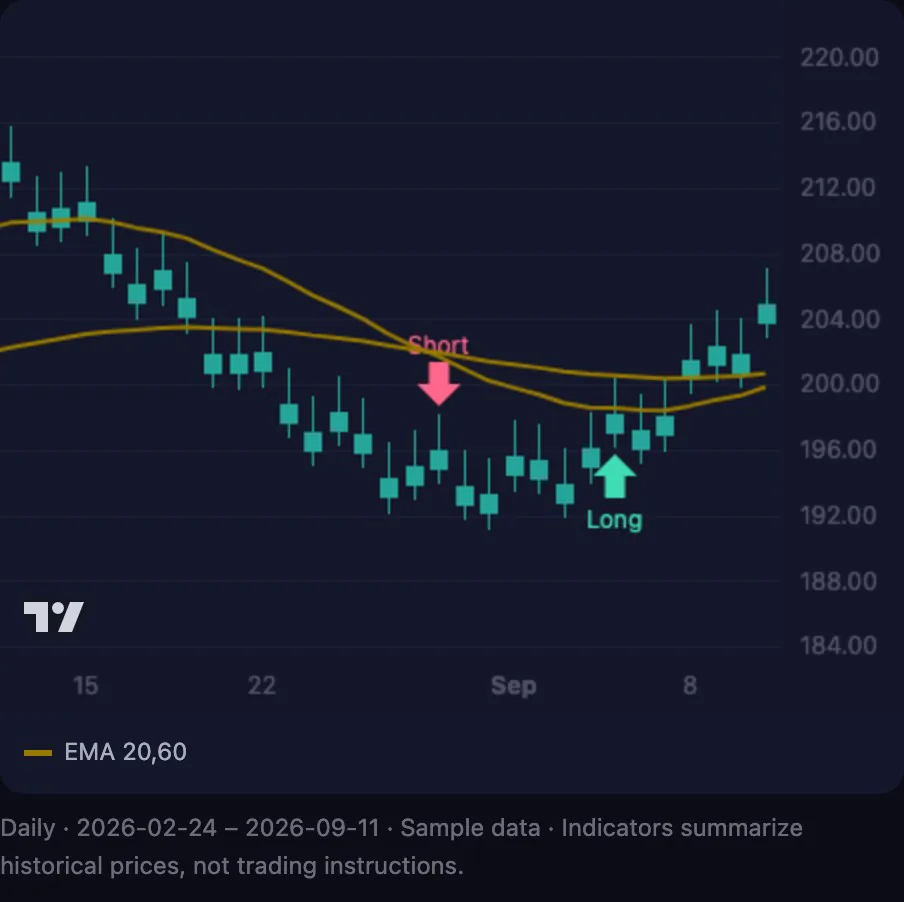
Long/Short marks reflect past EMA 20/60 and MACD 12/26/9 crossovers. They are signals to review, not orders or promises.
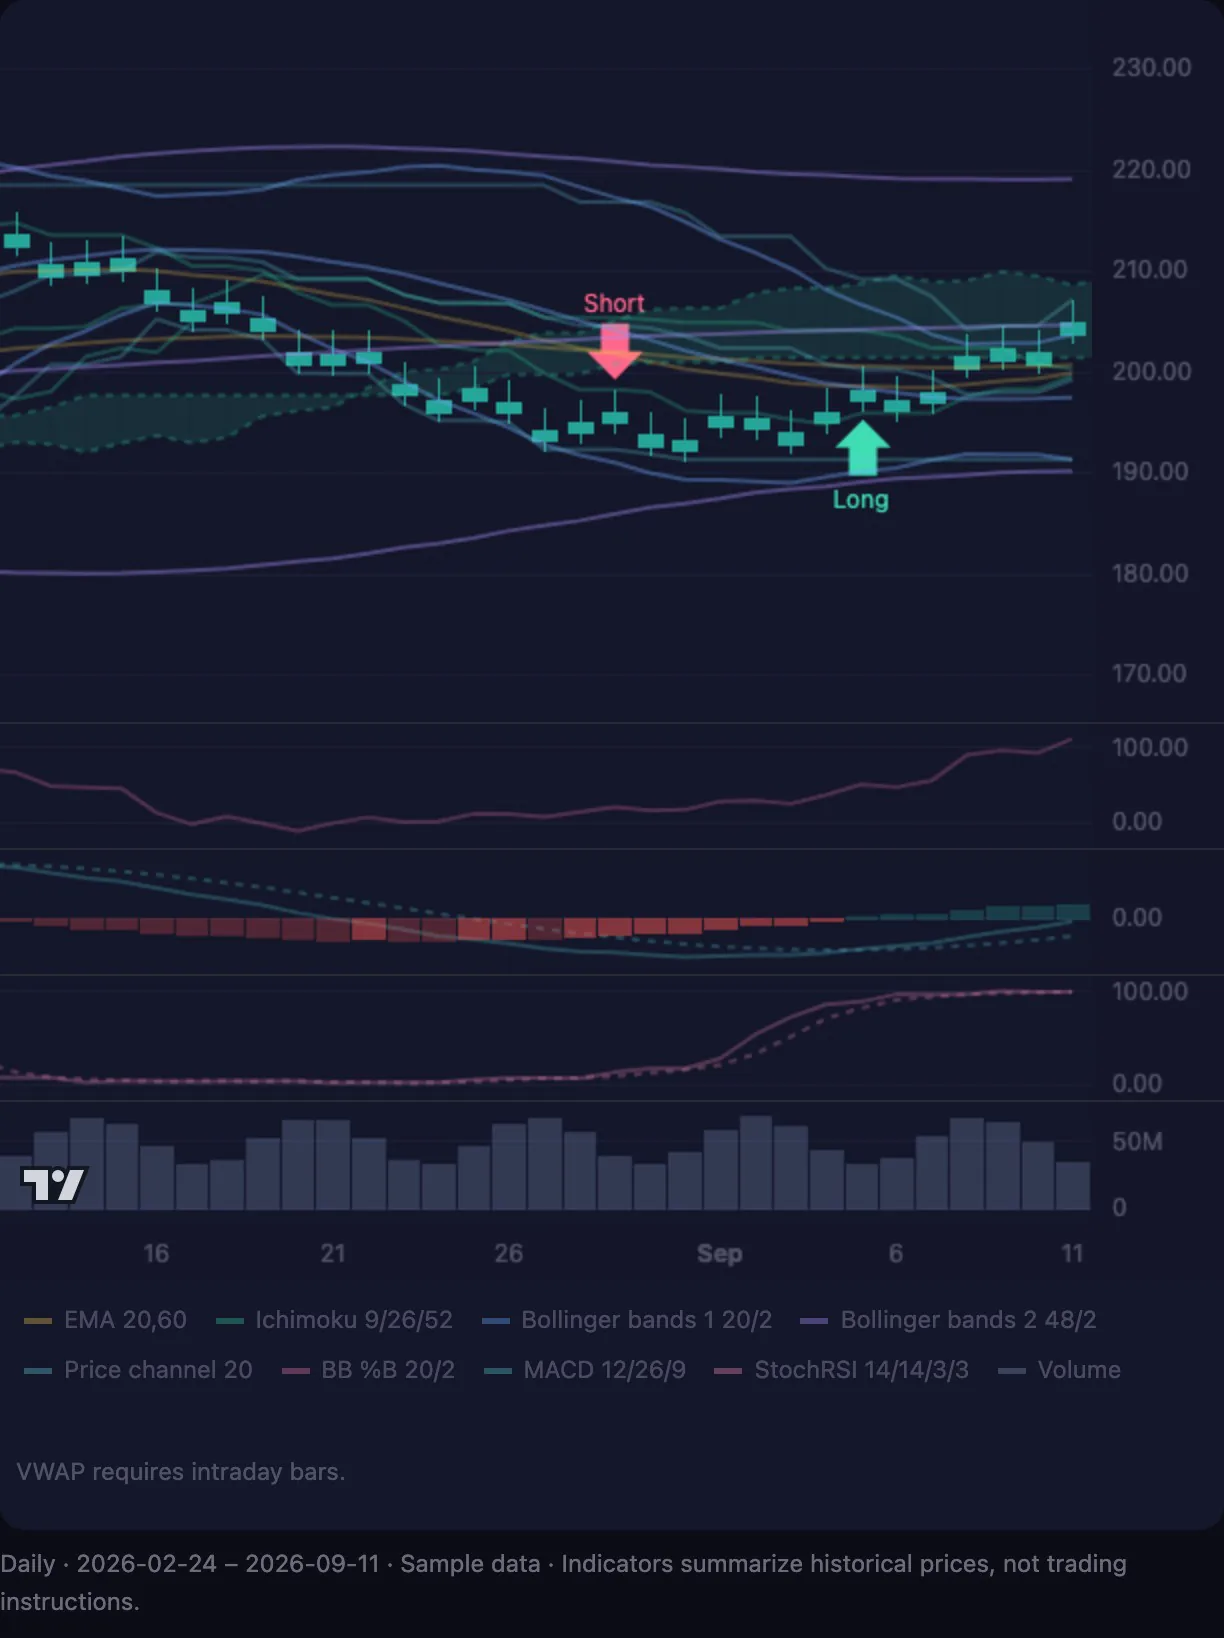
See the layers behind the chart
Double Bollinger bands, momentum and volume. Keep price in focus, with the indicators softly in view.
Make it easy to read
Choose colors and periods. Save up to 10 templates. Display settings do not change the signal logic.
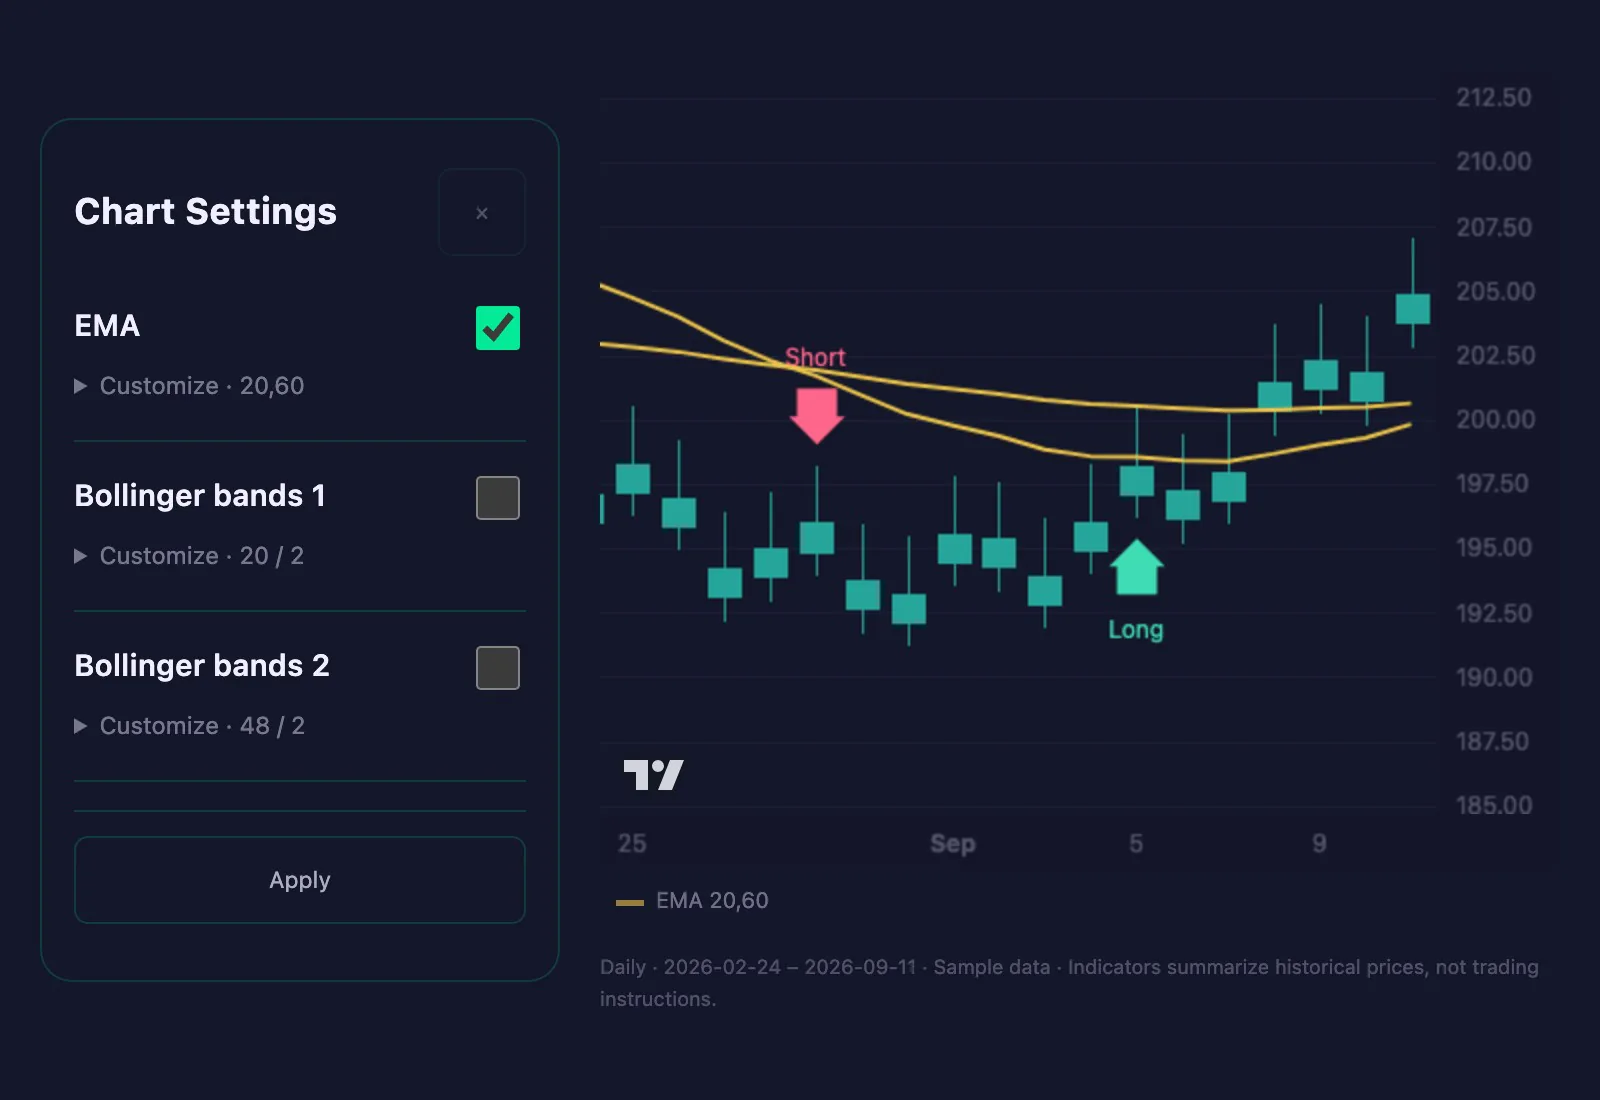
Settings example · sample data